May 2, 2026
Peptide purity: ensuring reliable data and compliance
Discover why purity matters in research and how it ensures reliable data and compliance. Uncover the truth behind peptide purity!

Peptide purity: ensuring reliable data and compliance
Imagine running the same receptor-binding assay three times with the same peptide batch and getting three meaningfully different EC50 values. Before you question your protocol or your equipment, consider what is actually in your vial. Uncharacterized impurities in research-grade peptides are one of the most underappreciated sources of experimental noise, and they can silently distort biological readouts in ways that are nearly impossible to detect without proper analytical documentation. This article breaks down what peptide purity really means, where contamination originates, and why a single percentage figure on a label is rarely the whole story.
Table of Contents
- What is peptide purity and how is it measured?
- Types of peptide impurities and their sources
- How peptide impurities impact experimental reliability
- Hidden purity pitfalls: consumables and analytical artifacts
- Why purity deserves more scrutiny: beyond the headline percent
- How ZYNOPEP supports research built on uncompromised purity
- Frequently asked questions
Key Takeaways
| Point | Details |
|---|---|
| Impurity profiles matter | Headline purity numbers alone can be misleading without full impurity characterization. |
| Trace contaminants are risky | Even low-level peptide impurities can alter experimental outcomes and increase compliance risks. |
| Labware impacts results | Choosing compatible filters and vials is necessary to avoid hidden losses and misquantification. |
| Orthogonal analysis is best | Using multiple analytical methods ensures a more accurate assessment of peptide purity. |
What is peptide purity and how is it measured?
To clarify why purity matters, let’s define exactly what is meant by “peptide purity” and how researchers assess it.
Peptide purity refers to the proportion of the intended peptide sequence present in a given sample relative to all other chemical species. It is most commonly expressed as a percentage of peak area in a chromatographic run. But that headline number, say 95% or 98%, tells you only part of what you need to know. A sample can report 98% purity by UV absorbance at 214 nm while still harboring structurally similar variants that carry biological activity of their own.
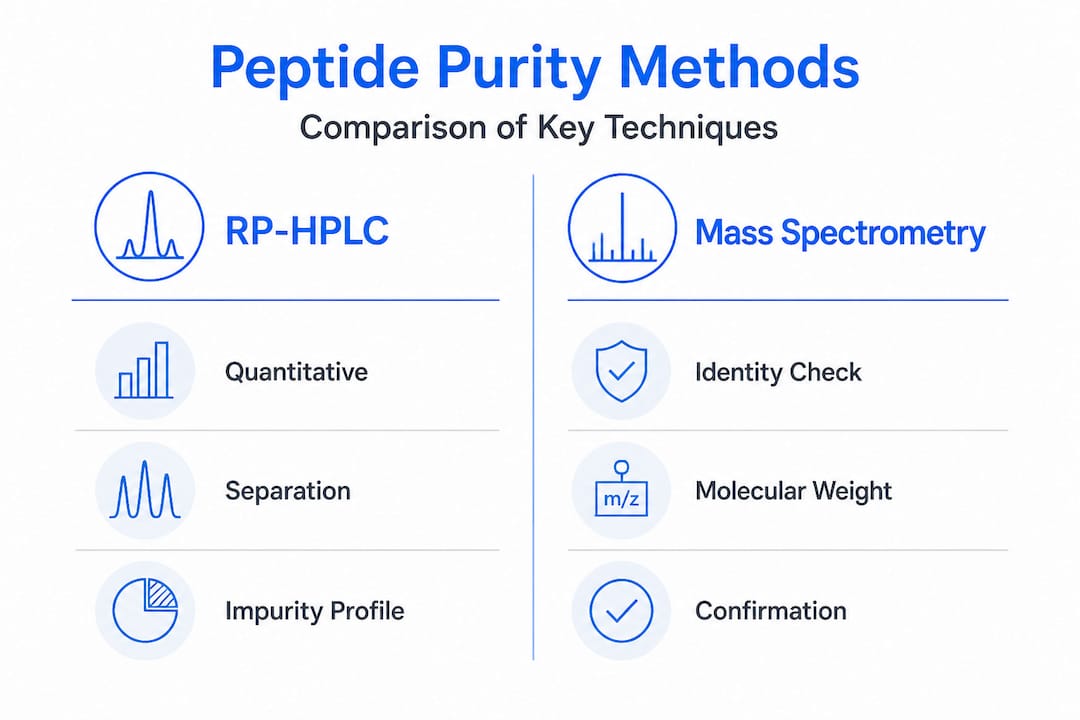
The most widely used measurement technique is HPLC (high-performance liquid chromatography), which separates peptide species by hydrophobicity and produces a chromatogram where each peak represents a distinct chemical entity. Purity is calculated as the percentage area of the main peak versus the total peak area. Reversed-phase HPLC (RP-HPLC) is the industry standard, though ion-exchange and size-exclusion variants are used for specific applications.
Mass spectrometry (MS) confirms molecular identity by verifying the molecular weight of the target peptide. It is excellent for identity confirmation but does not quantify impurities as reliably as HPLC alone. The combination of HPLC and MS, often called LC-MS, provides both quantitative separation and structural identification in a single workflow.
UV absorbance is fast and cost-effective but is limited because different peptides and impurities absorb UV light differently depending on their amino acid composition. A deletion peptide lacking a tyrosine residue, for example, will have a lower molar absorptivity at 280 nm and may be underestimated by UV alone.
As the MDPI analysis of peptide pools makes clear, impurities act as uncontrolled variables that change assay readouts, making biological effects hard to attribute to the intended sequence. This is why the impurity profile, meaning the full chromatogram with all minor peaks identified, is far more informative than any single percentage.
Key metrics to request from your supplier:
- Main peak purity (%) by RP-HPLC
- Full impurity chromatogram with peak identification
- Molecular weight confirmation by MS or LC-MS
- Counterion identity (e.g., TFA vs. acetate)
- Water content by Karl Fischer titration (for accurate mass-based dosing)
| Analytical method | Strength | Limitation |
|---|---|---|
| RP-HPLC | Quantitative separation of variants | Cannot identify unknown peaks alone |
| LC-MS | Identity confirmation + separation | Complex setup; not always quantitative |
| UV absorbance | Fast, low cost | Composition-dependent accuracy |
| NMR | Structural detail | Low throughput; not routine for QC |
Pro Tip: Always request the raw chromatogram, not just the purity percentage. A supplier who provides only a number without a traceable chromatogram cannot give you the impurity profile you need for defensible experimental design.
When sourcing premium research peptides for controlled assays, insist on full Certificates of Analysis (COA) that include chromatographic data, not just a summary table.
Types of peptide impurities and their sources
Now that you understand how purity is measured, let’s examine the types of impurities you may actually encounter and why they’re not always obvious.
Peptide impurities fall into two broad categories: synthesis-related and degradation-related. Both can be present in a freshly received vial, and both can accumulate over time if storage conditions are suboptimal.
Synthesis-related impurities arise during solid-phase peptide synthesis (SPPS) and include:
- Deletion peptides: sequences missing one or more amino acids due to incomplete coupling reactions
- Truncation peptides: N-terminally or C-terminally shortened fragments from premature chain termination
- Insertion variants: rare, but possible when protecting group removal is incomplete
- Racemization products: D-amino acid incorporation at chiral centers during activation steps
- Protecting group remnants: residual side-chain protecting groups not fully removed during deprotection
Degradation-related impurities develop after synthesis, during storage, shipping, or reconstitution:
- Oxidized methionine or tryptophan: common in peptides stored at room temperature or exposed to air
- Deamidation of asparagine and glutamine: produces aspartate and glutamate variants with altered charge
- Pyroglutamate formation: N-terminal glutamine spontaneously cyclizes, especially in acidic conditions
- Cysteine dimers: disulfide bond formation between two peptide molecules under oxidizing conditions
- Aggregation: non-covalent clusters that behave differently from monomeric peptide in solution
The MDPI peptide pool analysis confirms that degradation products including oxidation, deamidation, pyroglutamate formation, and cysteine dimers can all affect biological activity in ways that a headline purity number will not reveal. This matters enormously for why peptide purity is critical in any assay where receptor selectivity, enzyme kinetics, or immunological response is being measured.
“The impurity profile is the fingerprint of your peptide’s manufacturing and storage history. If you don’t read it, you’re flying blind.”
A particularly deceptive class of impurities is closely related variants. A deletion peptide missing a single internal residue may co-elute with the target peptide on a standard RP-HPLC column, appearing as a shoulder on the main peak rather than a distinct peak. Without high-resolution LC-MS, this variant goes undetected and enters your assay as an uncontrolled variable.
| Impurity type | Origin | Biological risk |
|---|---|---|
| Deletion peptide | Incomplete coupling in SPPS | May retain partial agonist/antagonist activity |
| Oxidized Met/Trp | Air exposure, improper storage | Reduced potency or altered binding |
| Pyroglutamate | Acidic pH, elevated temperature | Altered receptor recognition |
| Cysteine dimer | Oxidizing conditions | Aggregation, immunogenicity |
| Deamidated Asn | Neutral to alkaline pH, time | Charge shift, altered half-life |
How peptide impurities impact experimental reliability
Understanding what impurities exist is only part of the story. Here’s why even minor contaminants can alter your scientific conclusions or compliance status.
The most direct consequence of impurities is confounded biological readouts. Consider a substrate specificity study where you are using a synthetic peptide to characterize a protease’s cleavage site. If your peptide contains even 2-3% of a variant with a modified N-terminus, that variant may be completely resistant to cleavage. Your measured cleavage efficiency will be artificially low, and the kinetic parameters you derive will be incorrect. This is not a hypothetical scenario. It is a well-documented source of irreproducibility in enzymology.

Immunological assays are particularly vulnerable. In a competitive ELISA (enzyme-linked immunosorbent assay), an impurity that shares an epitope with the target peptide will compete for antibody binding, suppressing your signal and making your target appear less abundant than it actually is. Conversely, an impurity that cross-reacts with a secondary antibody can inflate your signal.
The compliance dimension is equally serious. Trace impurities can pose specific risk dimensions such as immunogenicity, which intersects directly with safety and compliance workflows in GLP (Good Laboratory Practice) and GMP (Good Manufacturing Practice) environments. When your research feeds into regulatory submissions or safety dossiers, impurity documentation is not optional. Reviewers will ask for it.
Steps to protect experimental integrity from impurity-related errors:
- Request and archive the full COA and impurity chromatogram for every peptide lot you use.
- Perform lot-to-lot comparisons when switching between batches, even from the same supplier.
- Confirm molecular weight by MS before beginning any new assay series.
- Run a pilot experiment with a known-pure reference standard to establish your baseline response.
- Document storage conditions and reconstitution dates to track degradation over time.
- Flag any unexpected assay variability for root-cause analysis that includes purity re-testing.
Pro Tip: For controlled peptide experiments that feed into publications or regulatory submissions, treat each peptide lot as a unique reagent. Assign it a lot number in your lab notebook and link it directly to the COA. This simple practice can save weeks of troubleshooting when a reviewer questions your data.
Reproducibility is also at stake. A 2024 analysis of peptide-based assay reproducibility found that inter-laboratory variability was significantly reduced when all sites used peptides from the same batch with verified impurity profiles, compared to sites that sourced independently with only headline purity data. The lesson is clear: impurity profiles are not just quality documents. They are experimental controls.
Hidden purity pitfalls: consumables and analytical artifacts
Even when the peptide itself passes all purity checks, sources for error still lurk in your laboratory workflow.
This is one of the most underappreciated aspects of peptide research: your consumables and sample preparation steps can introduce errors that mimic or mask true purity problems. A peptide that is genuinely 99% pure in the vial can appear to be present at a far lower concentration by the time it reaches your detector, simply because of how it was handled.
Adsorption to surfaces is a major culprit. Many peptides, especially those that are hydrophobic or positively charged, bind non-specifically to polypropylene tubes, glass vials, and filter membranes. When you prepare a 1 µM working solution and then pass it through an ultrafiltration membrane to remove aggregates, you may lose 20-40% of your peptide to the membrane itself. Your quantification will be wrong, and your dose-response curve will be shifted.
As a LC-MS case study of β-endorphin demonstrates, analytical artifacts in consumables including sample filters and vial materials can produce peptide quantification errors that undermine experimental conclusions. This is not a marginal concern. It is a documented, reproducible source of false data.
“A peptide’s journey from vial to detector is full of opportunities for loss. Every surface it touches is a potential trap.”
Best practices for minimizing consumable-related errors:
- Use low-binding microcentrifuge tubes and plates (e.g., polypropylene with low-adsorption coating) for all peptide handling
- Test filter membrane compatibility before committing to a filtration step; measure peptide concentration before and after
- Add internal standards (isotopically labeled analogs when available) to correct for recovery losses in LC-MS quantification
- Avoid glass vials for highly basic or hydrophobic peptides unless silanized
- Prepare working solutions fresh and minimize the number of freeze-thaw cycles
- Validate your sample prep workflow with a known concentration of your target peptide before running real samples
The interaction between structural impurity risks in peptides and analytical workflow errors is multiplicative, not additive. A peptide with a borderline impurity profile, handled with incompatible consumables, can produce data that is unreliable in ways that are genuinely difficult to diagnose after the fact.
Why purity deserves more scrutiny: beyond the headline percent
Here is a perspective that runs counter to how many labs actually operate: the headline purity percentage has become a false proxy for quality assurance, and the research community has largely accepted it without question.
We have seen this pattern repeatedly. A lab orders a peptide advertised at “greater than 95% purity,” runs their assay, and gets results that don’t replicate. They repeat the order, get the same headline number, and assume the peptide is fine. What they never do is look at the chromatogram. When we look at it for them, the picture is often more complicated. There may be a cluster of small peaks between 2% and 4% of total area, each representing a different variant, none of which was characterized. Together, they represent a cocktail of uncontrolled biological variables.
The solution is not to demand impossibly high purity levels. It is to demand information. A peptide at 96% purity with a fully characterized impurity profile, where every minor peak is identified by MS and confirmed to be biologically inert in your assay context, is far more useful than a peptide at 99% purity with no documentation of what the remaining 1% contains.
Orthogonal verification, meaning using both RP-HPLC and MS as complementary methods, should be routine for any peptide used in a critical workflow. HPLC tells you how much of each species is present. MS tells you what those species are. Neither alone is sufficient for high-confidence work.
We also advocate for reviewing detailed peptide impurity profiles as part of your standard reagent qualification process, the same way you would validate an antibody lot or verify a cell line’s identity. Peptides are not commodity reagents. They are precisely defined molecular tools, and they deserve the same rigor.
The labs that consistently produce reproducible, publication-quality data from peptide-based assays are not necessarily using more expensive peptides. They are using better-documented peptides and applying systematic controls around them.
How ZYNOPEP supports research built on uncompromised purity
If the sections above have raised questions about your current peptide sourcing strategy, the path forward starts with documentation.
At ZYNOPEP, every research peptide ships with a full Certificate of Analysis that includes the raw RP-HPLC chromatogram, LC-MS identity confirmation, and a complete impurity profile, not just a headline percentage. Purity is verified at ≥99% by third-party testing, and all documentation is traceable and available for GLP audit purposes. Whether you are working with BPC-157, TB-500, or custom reference peptides for in-vitro studies, you get the analytical transparency your experimental design requires. Temperature-controlled shipping and rapid order processing ensure the peptide that arrives in your lab matches the one that was characterized. Your data deserves that foundation.
Frequently asked questions
How pure do peptides need to be for research assays?
For most controlled experiments, a minimum of 95% purity is a reasonable starting point, but the impurity profile matters as much as the percentage, since uncharacterized variants can act as uncontrolled biological variables regardless of their relative abundance.
What risks do trace impurities present in peptide-based studies?
Trace impurities can trigger unexpected biological effects including immunogenicity, and even minor contaminants can increase assay variability and create compliance risk in GLP or GMP research environments.
Can vial or filter materials affect perceived peptide purity?
Yes, peptides can adsorb onto polypropylene, glass, and filter membranes, causing quantification errors in sample prep that are often mistaken for purity or potency issues with the peptide itself.
Why is orthogonal analysis recommended for impurity detection?
A single analytical method cannot detect all impurity types reliably. Orthogonal methods such as LC-MS combined with RP-HPLC provide complementary data that together reveal impurities invisible to either technique alone.